


General Motors enters late 2025 with shares near $58.71 after a rebound over the summer; the stock is up 20.14% over 52 weeks, outpacing the S&P 500 at 17.59%. Under the hood, GM posts $187.6B in TTM revenue, a 2.55% profit margin and 4.70% operating margin, with EBITDA of $16.64B and $6.52B in net income, while quarterly revenue growth is -1.80% year over year. Headlines point to a tactical slowdown in EV production as U.S. tax credits sunset and management focuses on cost discipline, even as rumors of new Chevrolet products keep the ICE portfolio engaged. With $20.94B in cash, $137.05B in total debt, and levered free cash flow of $1.41B, the three-year outlook hinges on pacing the EV transition, protecting margins, and balancing capital returns with deleveraging.
Key Points as of September 2025
- Revenue: TTM revenue of $187.6B; quarterly revenue growth (yoy) at -1.80% signals a softer near-term sales environment.
- Profit/Margins: Profit margin 2.55%, operating margin 4.70%; EBITDA $16.64B and net income $6.52B; diluted EPS 6.55.
- Cash flow & liquidity: Operating cash flow $23.97B; levered free cash flow $1.41B; total cash $20.94B; current ratio 1.22.
- Leverage: Total debt $137.05B with total debt/equity at 200.19% underscores the importance of disciplined capital allocation.
- Sales/Backlog: Negative revenue growth (yoy) and headlines on EV production pacing reflect demand uncertainty and supply coordination needs.
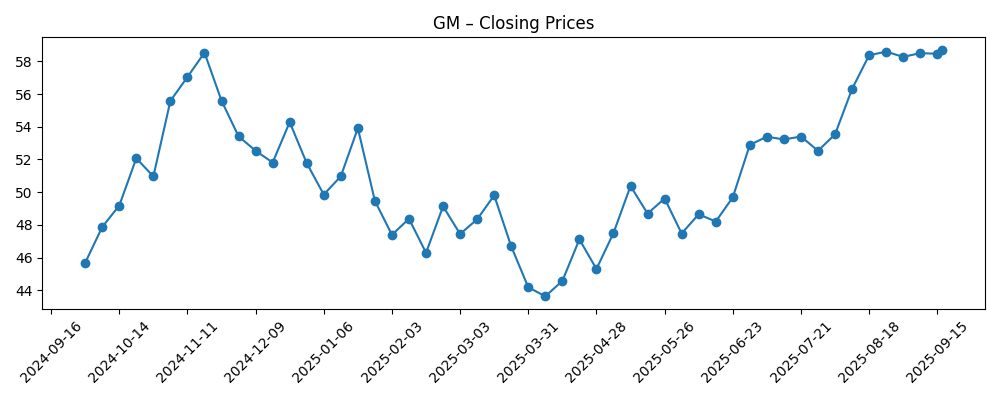
- Share price: Recent close ~$58.71 (Sep 17, 2025); 52-week range 41.60–61.24; 50-day MA 55.22; 200-day MA 50.70; beta 1.32.
- Analyst/investor context: 52-week change +20.14% vs S&P 500 +17.59%; institutional ownership 86.45%; short interest 2.14% of float; short ratio 2.52.
- Market cap: Approximately $55.9B (shares outstanding 952.08M × recent price).
Share price evolution – last 12 months
Notable headlines
- GM slows EV production as tax credit nears expiration (The Verge)
- Plagued by Parts Shortage and EV Demand Uncertainty, GM Prepares for Layoffs (Gizmodo)
- Market Reaction: GM Rolls Back EV Production (Yahoo)
- How Is General Motors’ Stock Performance Compared to Other Automotive Stocks? (Barchart)
- This Is Why MasterCraft Partners With GM As Its Towing Partner (Forbes)
- Chevrolet sparks excitement after rumors tease return of iconic model (Yahoo)
Opinion
GM’s decision to modulate EV production into the expiration of certain U.S. tax credits appears pragmatic. A slower, profitability-first cadence can preserve margins while supply chains normalize and battery costs continue their gradual decline. With TTM operating margin at 4.70% and profit margin at 2.55%, management’s priority is likely to defend earnings quality rather than chase volume at any price. The headlines about potential layoffs and parts constraints highlight real execution risks; nevertheless, $20.94B of cash and $23.97B in operating cash flow provide flexibility to bridge uneven quarters. Over the next three years, the company’s ability to balance ICE strength, targeted EV launches, and selective hybrid offerings may determine whether revenue resumes steady growth from today’s $187.6B base without sacrificing returns.
The share price context is constructive but not complacent. Trading near $58.71 and within reach of a 52-week high of 61.24, GM has outperformed the S&P 500 over the past year (+20.14% vs +17.59%). Momentum above the 50-day and 200-day moving averages (55.22 and 50.70) suggests improving sentiment, while a beta of 1.32 implies that macro swings can quickly amplify moves. Short interest remains modest (2.14% of float; short ratio 2.52), which typically limits the likelihood of disorderly squeezes but also suggests fewer embedded buyers if headlines turn negative. Into 2028, valuation re-rating potential will hinge on margin trajectory and evidence that EV units can be added profitably—especially as policy tailwinds roll off.
Capital allocation is a swing factor. A low payout ratio (7.79%) and a forward dividend yield around 1.03% indicate capacity to raise distributions over time, but leverage is the counterweight: total debt of $137.05B and a debt/equity of 200.19% argue for continued deleveraging. If management can sustain positive free cash flow beyond the current $1.41B levered figure while keeping product cadence intact, GM could both de-risk the balance sheet and maintain buybacks opportunistically. Partnerships that monetize technology and brand strength—such as towing and performance collaborations—can supplement margins without heavy capital intensity, providing optionality during the EV ramp.
Execution risks are non-trivial. A negative -1.80% quarterly revenue growth print underscores a market where pricing, incentives, and consumer affordability are in flux. Potential layoffs, while supportive of near-term cost control, may complicate longer-term capacity and product timing. The strategy to prioritize profitable EVs and keep Chevrolet and GMC portfolios fresh could stabilize demand while policy uncertainty clears. Over the next three years, investors should watch for tighter alignment between capacity plans and order intake, clearer battery supply visibility, and software/aftermarket monetization that can lift returns on assets (2.27% today) and equity (6.96%). If these pieces fall into place, GM’s multiple could expand; if not, volatility near the lower end of the recent range is plausible.
What could happen in three years? (horizon September 2025+3)
| Scenario | Operating profile | EV strategy | Balance sheet & capital returns | Share price implication |
|---|---|---|---|---|
| Best case | Margins expand from current levels via mix, cost, and software; revenue trends improve with disciplined pricing. | Profitable, paced EV rollout after credit sunset; battery supply and quality stabilize. | Leverage declines; steady dividend growth and opportunistic buybacks sustained. | Re-rating toward stronger auto peers; potential to trade above recent highs as confidence builds. |
| Base case | Stable margins with incremental efficiency; revenue broadly tracks industry cycles. | Select EV launches aligned to demand; ICE and hybrids offset timing gaps. | Leverage contained; dividends maintained; buybacks deployed selectively. | Range-bound near recent averages with macro-driven swings. |
| Worse case | Pricing pressure and labor costs compress margins; revenue softness persists. | EV delays and supply issues extend; inventory and capex inefficiency weigh on cash. | Leverage rises; dividend growth paused; buybacks curtailed. | Multiple compresses; tests lower end of recent trading range. |
Projected scenarios are based on current trends and may vary based on market conditions.
Factors most likely to influence the share price
- EV policy and incentives: timing and structure of U.S. tax credits and regulatory targets that affect demand and profitability.
- Supply chain reliability: parts availability and battery sourcing that determine production cadence and costs.
- Labor and cost discipline: wage settlements, layoffs, and productivity programs that shape margins.
- Balance sheet and rates: leverage management and interest-rate path impacting refinancing and cash flow.
- Product cadence and brand strength: Chevrolet/GMC pipeline and partnerships that support mix and pricing.
- Competitive intensity: pricing and technology moves by peers across ICE, hybrid, and EV segments.
Conclusion
GM’s three-year story is about pacing—right-sizing EV ambition to economic reality while defending returns. The company begins from a position of solid scale ($187.6B TTM revenue) and meaningful cash generation ($23.97B operating cash flow), but with modest profitability (2.55% margin) and elevated leverage (debt/equity 200.19%). Recent actions to slow EV production as credits sunset suggest a focus on profitable units and cost control, even as the ICE portfolio and select partnerships keep brand engagement high. If management aligns capacity to demand, tightens supply chains, and proves out profitable EV trims, margins can expand and valuation could improve from current levels. Conversely, persistent demand volatility or execution setbacks could pressure free cash flow and limit capital returns. Against this backdrop, disciplined monitoring of margins, cash conversion, and launch cadence will be key to the equity case.
This article is not investment advice. Investing in stocks carries risks and you should conduct your own research before making any financial decisions.